
Connect Firebase Analytics and BigQuery with Google DataStudio using custom queries
Firebase Analytics is a powerful tool to get insights into how the users of your app behave.
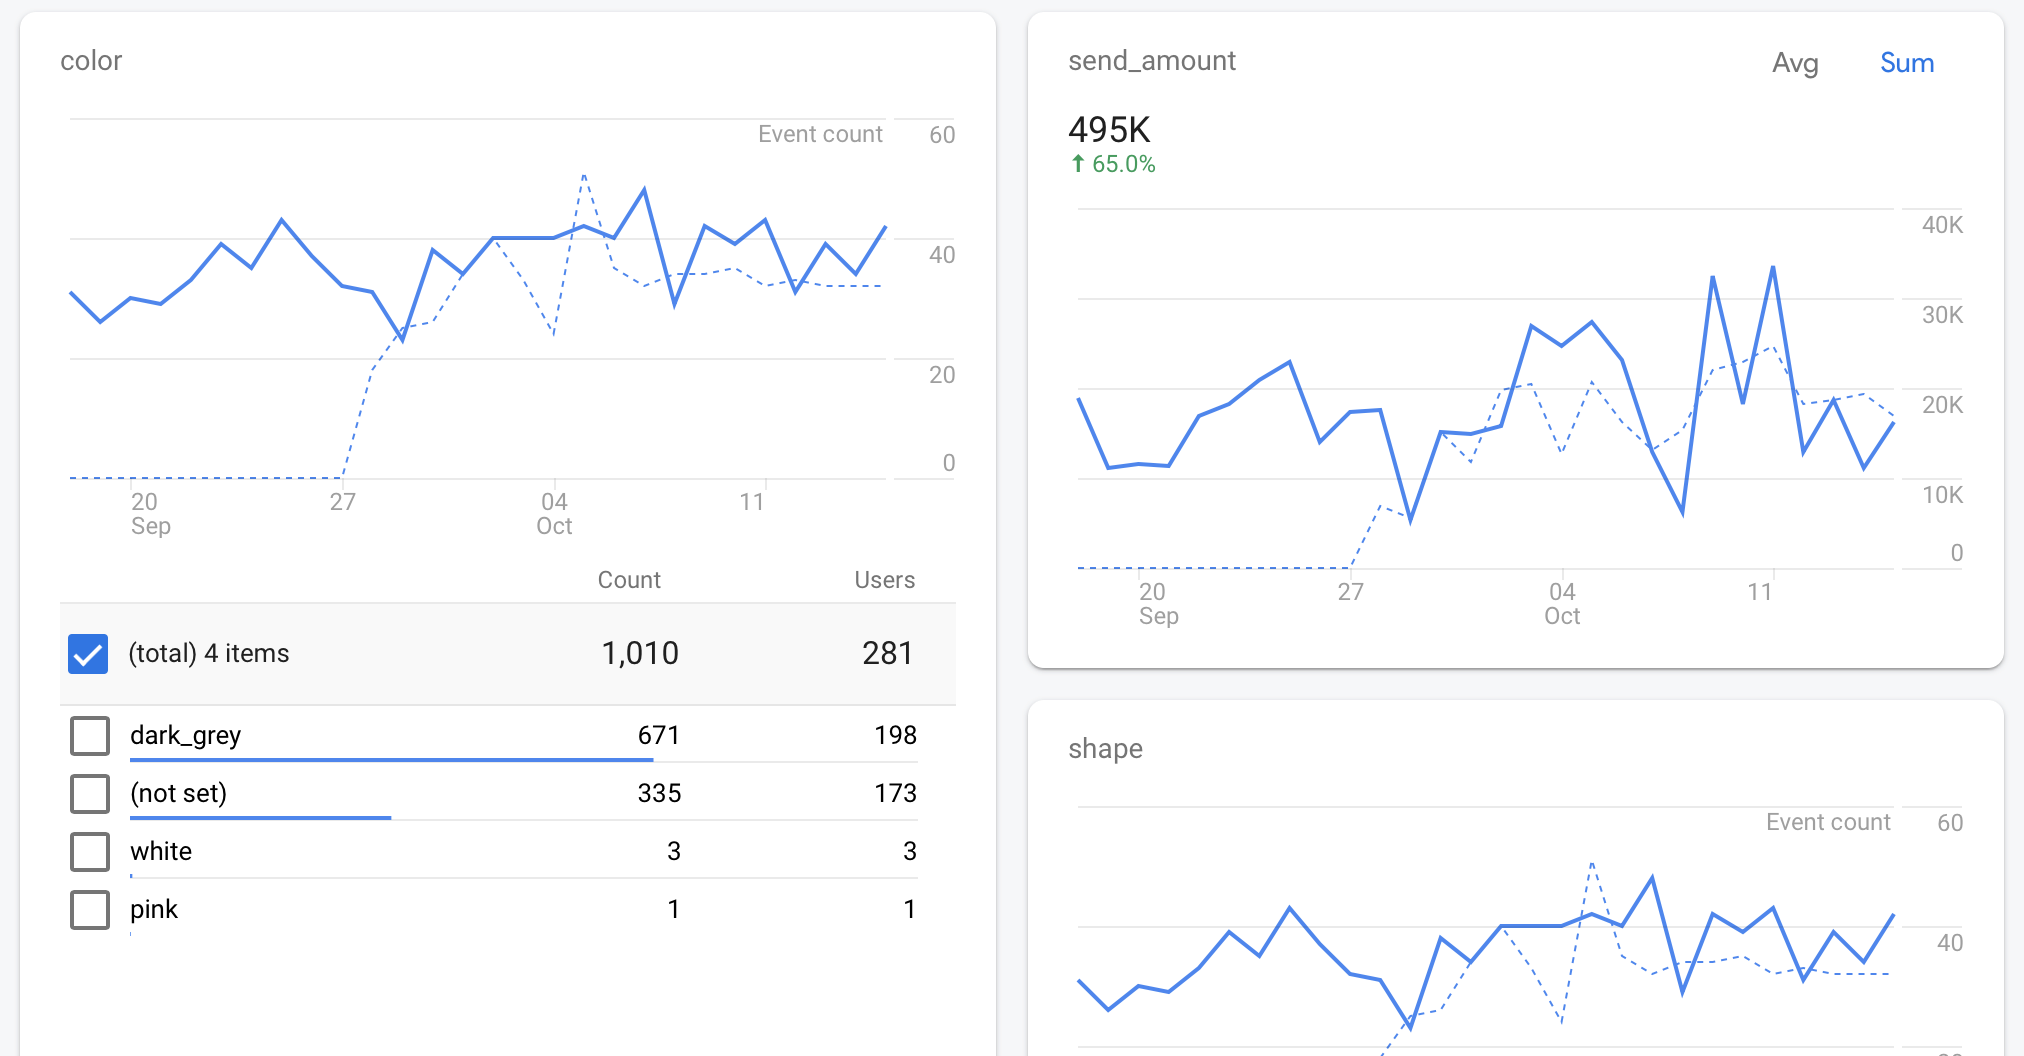
You can see the trend of the number of active users, daily user engagement, and if you have custom numeric parameters associated with your events, you can even see graphs with the average or sum of the value of that parameter.
But the basic reporting capability of Firebase Analytics is very limited. You cannot perform custom queries of any form, so you are bounded to the default graphs and tables.
For instance, let’s say your app allows users to send stickers. The app tracks the shape and color of the stickers, together with the number of stickers, by using custom-parameter reporting.
In Firebase Analytics you can see the total number of stickers sent, and, with filtering, you can also see the total sum for each color or each shape.
But it is not possible to have, in a single table, the total number of sent stickers grouped by color and by shape.
BigQuery to the rescue
To be able to get the best out of your Firebase data, you need to connect analytics to BigQuery, a cost-effective big data tool from Google.
Linking your Firebase Analytics to BigQuery can be done from the Firebase project settings, in the Integrations.

Search for BigQuery, and click Link, Next, then enable Google Analytics and click Link to BigQuery.
Now your analytics data will be loaded in BigQuery, but it can take up to 24 hoursto see it.
Connect BigQuery to Data Studio
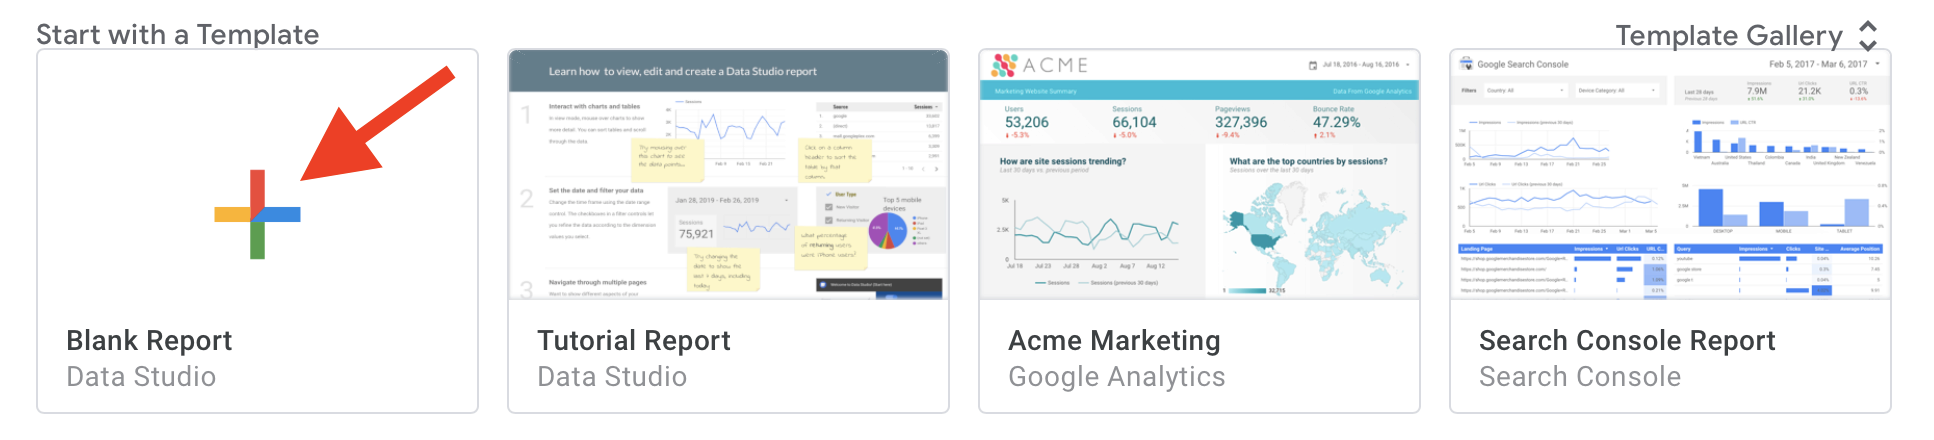
You do not need to use BigQuery directly, you can use other tools to visualize the data in it. For instance, Google Data Studio. Start a new Blank Report
In the Add data to report Connect to data tab select BigQuery. Select _Custom query_and then select the correct project.
In the Enter Custom Query field enter your query, for the data above this will do:
SELECT SUM(send_amount) AS total, color, shape
FROM (
    SELECT event_name, event_timestamp, user_pseudo_id,
        (SELECT value.int_value FROM UNNEST(event_params)
            WHERE key = "send_amount") AS send_amount,
        (SELECT value.string_value FROM UNNEST(event_params)
            WHERE key = "color") AS color,
        (SELECT value.string_value FROM UNNEST(event_params)
            WHERE key = "shape") AS shape
    FROM `PROJECT_ID.analytics_TABLE_NUMBER.events_*`
    WHERE event_name = "send"
    AND _TABLE_SUFFIX BETWEEN @DS_START_DATE AND @DS_END_DATE
)
GROUP BY color, shape
where PROJECT_ID is your project id from Firebase, and the TABLE_NUMBER can be found from your BigQuery console.
Enable Enable date parameters, which allows using @DS_START_DATE and @DS_END_DATE in the query above, so that the viewer of the report can select a time period.
If you are curious about the UNNEST command, you can read more about it in the articles from the Firebase team How to use the UNNEST function in BigQuery to analyze event parameters in Analytics and How to use SELECT FROM UNNEST to analyze multiple parameters in BigQuery for Analytics.
Show the data in Data Studio
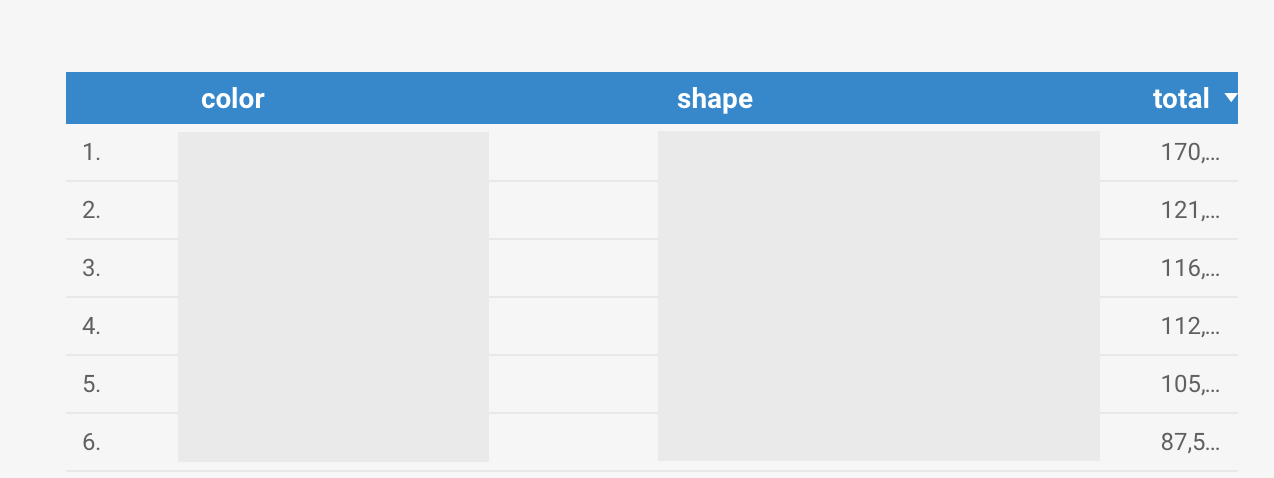
In editor mode in Data Studio select Add a chart and click on Table. In Dimension select Color and Shape. In Metric select total and as its aggregation select SUM.
Now your table should show the total sum aggregated by two custom parameter values.
Leave a comment